This sample shows a replacement-cost-minus-depreciation valuation alongside a scope of repair, which is how most first-party property claims are presented to a carrier.
The sample is the complete report as a watermarked PDF, using illustrative figures,
not real project data. Your own report is generated live from the numbers you enter and is
not watermarked.
Advertisement
What the sample contains
Transmittal letter, addressed and ready to sign
Cover page with prepared-by / prepared-for details, the headline figure and the basis of the calculation
Full line-item breakdown showing each intermediate step and how the total is built
Methodology & citations documenting the formula behind every line
Supporting documents checklist for submission to an owner, insurer or counsel
What you need to run one of these
Ten to twenty minutes for a multi-trade scope, most of it entering the line-item estimate. A single-trade loss takes a couple of minutes.
Replacement cost by trade line
Age and expected useful life for each line
Labor percentage of each line, where the state restricts depreciating labor
Soft costs: general contractor overhead and profit, permits, design fees
The governing state, which sets the labor-depreciation and holdback rules
Depreciate each trade on its own age and life rather than applying one blended rate. A ten-year-old roof and new interior finishes do not depreciate alike and a blended rate is the first thing a reviewer challenges.
Nothing you enter is uploaded. The calculation and the parsing of any spreadsheet
you import happens entirely in your own browser.
How to read this report
The report separates replacement cost from actual cash value at every line rather than only at the total, so it is clear exactly where depreciation was applied and how much. The labour percentage appears as its own input, because in states that bar depreciating labour that split is the whole argument.
What reviewers look for
Adjusters and carrier reviewers look for the basis of the effective age, the age-life source and whether recoverable depreciation is stated as its own figure rather than netted into the total. All three are on the face of the report.
Who uses this report
Public adjusters and policyholder-side contractors, restoration companies preparing supplements and attorneys handling coverage or bad-faith disputes where the ACV calculation itself is contested.
Whichever you are, the arithmetic is free: run the
calculator as many times as you like and pay only
when you want the branded, citation-backed document assembled.
Frequently asked questions
Are these real claim figures?
No. Every sample uses illustrative figures rather than real project or claimant data. The point is to show the layout, the level of detail and the methodology, so you can judge whether the finished report is what you need before you pay for one.
What is the difference between the sample and what I would get?
The sample is a watermarked PDF. A paid report is unwatermarked, carries your own logo and company details and comes as a live-formula Excel workbook and an editable Word document alongside the PDF.
Can I edit the numbers after export?
Yes. The Excel workbook keeps working formulas rather than pasted values, so changing an input updates the totals. The Word document is a normal editable document.
min(Effective Age ÷ Total Useful Life, 100%) × RCV, the straight-line age/life method.
Actual Cash Value
ACV = RCV − Depreciation Amount. State law varies: some jurisdictions define ACV as fair market value or apply the broad evidence rule rather than replacement cost less depreciation.
Depreciation of Labour
Eight states prohibit depreciating the labour component of a property loss. Where that applies, age/life depreciation falls on the materials portion only and the actual cash value is correspondingly higher. ClaimDuke classifies all 51 jurisdictions as prohibited, permitted or unsettled, applies the rule for the state you select and states its position on the methodology page of the report.
Total Scope
Hard Cost + (Hard Cost × (Engineering/Permit% + Contingency%)).
What the paid Excel workbook looks like
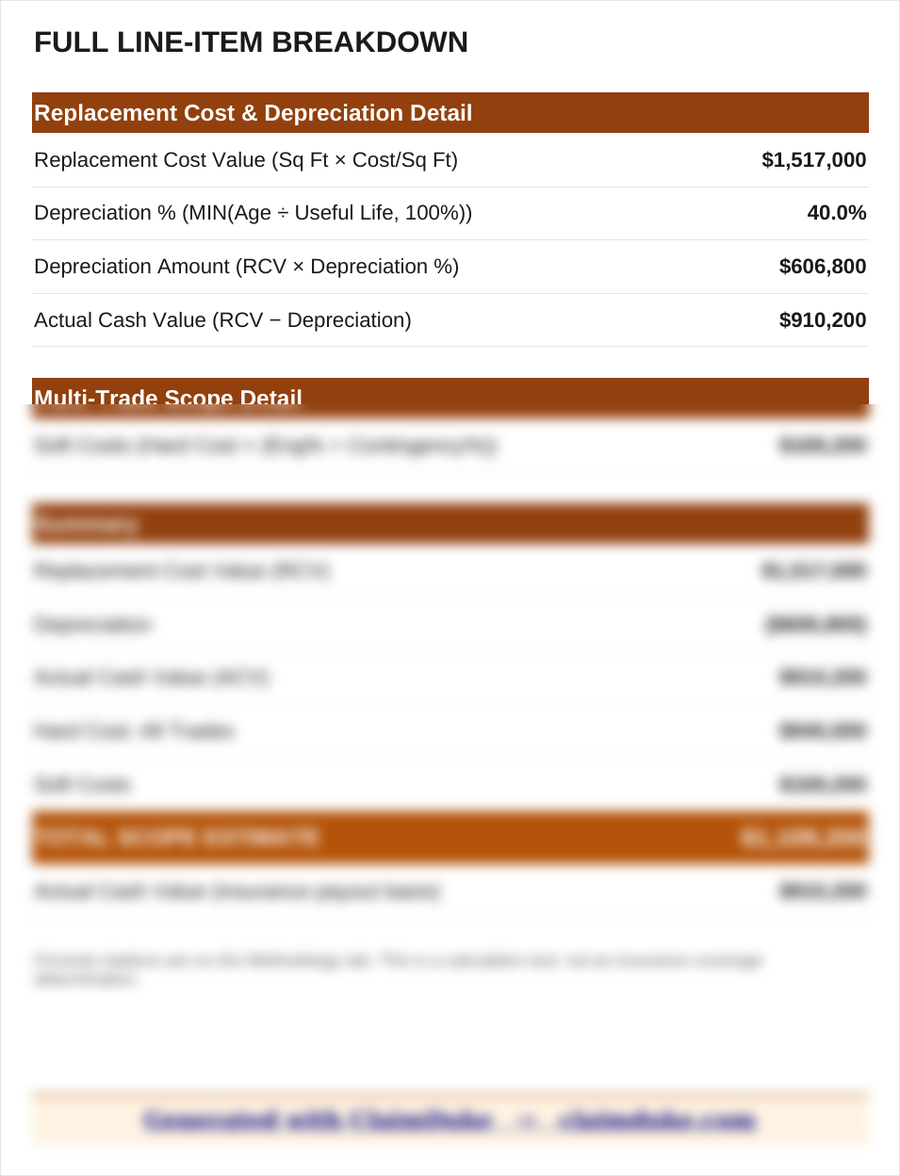
The sample PDF above shows the report. This is the Full Line-Item Breakdown
sheet from the formatted Excel workbook a paid report also includes, rendered from an
actual generated workbook rather than a mock-up. Every figure on it is a live formula
reading from an Inputs tab, so changing an input recalculates the whole workbook.
Excel workbook, Full Line-Item Breakdown sheet. Lower rows are obscured on purpose; the full sheet comes with a paid report.
Sample versus a paid report
The sample is a fixed, watermarked PDF. A paid report is generated live from your own
figures and adds a formatted Excel workbook with working formulas, a matching Word
document, an unwatermarked PDF and your own logo or letterhead. The monthly plan
additionally includes a Scenario Comparison sheet for modelling conservative, likely and
aggressive positions.