This sample shows how ClaimDuke builds a bill rate from a base wage: percentage burdens, per-hour fixed costs, overhead recovery and the margin step that most rate sheets get wrong.
The sample is the complete report as a watermarked PDF, using illustrative figures,
not real project data. Your own report is generated live from the numbers you enter and is
not watermarked.
Advertisement
What the sample contains
Transmittal letter, addressed and ready to sign
Cover page with prepared-by / prepared-for details, the headline figure and the basis of the calculation
Full line-item breakdown showing each intermediate step and how the total is built
Methodology & citations documenting the formula behind every line
Supporting documents checklist for submission to an owner, insurer or counsel
What you need to run one of these
Five to ten minutes. The two figures people usually have to go and find are the SUTA rate notice and the overhead pool from the year-end financials.
Base hourly wage
Payroll tax percentages (FICA, FUTA and your own SUTA rate)
Workers' compensation rate and experience modifier
Fringe, PTO and other percentage loads
Per-hour fixed costs such as health contributions and small tools
Annual overhead pool and annual productive hours
Target margin, if you want a bill rate rather than a cost rate
Use productive hours rather than paid hours as the divisor. Dividing an annual overhead pool by 2,080 understates the rate, often by ten percent or more.
Nothing you enter is uploaded. The calculation and the parsing of any spreadsheet
you import happens entirely in your own browser.
How to read this report
The build-up runs in one direction: base wage, then percentage burdens, then per-hour fixed costs, then overhead per productive hour, then margin. Each stage is shown as both a dollar figure and a percentage of base wage, because reviewers think in percentages and contracts are written in dollars.
What reviewers look for
The two questions asked most often are where the overhead pool came from and what the hours divisor is. Both are stated explicitly on the Methodology page rather than buried in a multiplier, which is the difference between a rate that gets accepted and one that gets reworked.
Who uses this report
Contractors pricing change orders and extra work, claims consultants supporting a labour component of a larger claim and attorneys who need a burdened rate that will survive line-by-line examination.
Whichever you are, the arithmetic is free: run the
calculator as many times as you like and pay only
when you want the branded, citation-backed document assembled.
Frequently asked questions
Are these real claim figures?
No. Every sample uses illustrative figures rather than real project or claimant data. The point is to show the layout, the level of detail and the methodology, so you can judge whether the finished report is what you need before you pay for one.
What is the difference between the sample and what I would get?
The sample is a watermarked PDF. A paid report is unwatermarked, carries your own logo and company details and comes as a live-formula Excel workbook and an editable Word document alongside the PDF.
Can I edit the numbers after export?
Yes. The Excel workbook keeps working formulas rather than pasted values, so changing an input updates the totals. The Word document is a normal editable document.
Methodology used in this report
Fully Burdened Rate
Base Wage + (Wage × (Payroll Tax + Workers' Comp + PTO + Other)%) + Health + Tools.
Overhead Recovery
Annual Overhead Pool ÷ Annual Company Billable Hours. The pool is company-wide, so the divisor must be company-wide billable hours rather than one employee's annual hours.
Bill Rate
(Fully Burdened Rate + Overhead per Hour) ÷ (1 − Margin%). Dividing by (1 − margin) produces margin on the bill rate, not a markup on cost.
What the paid Excel workbook looks like
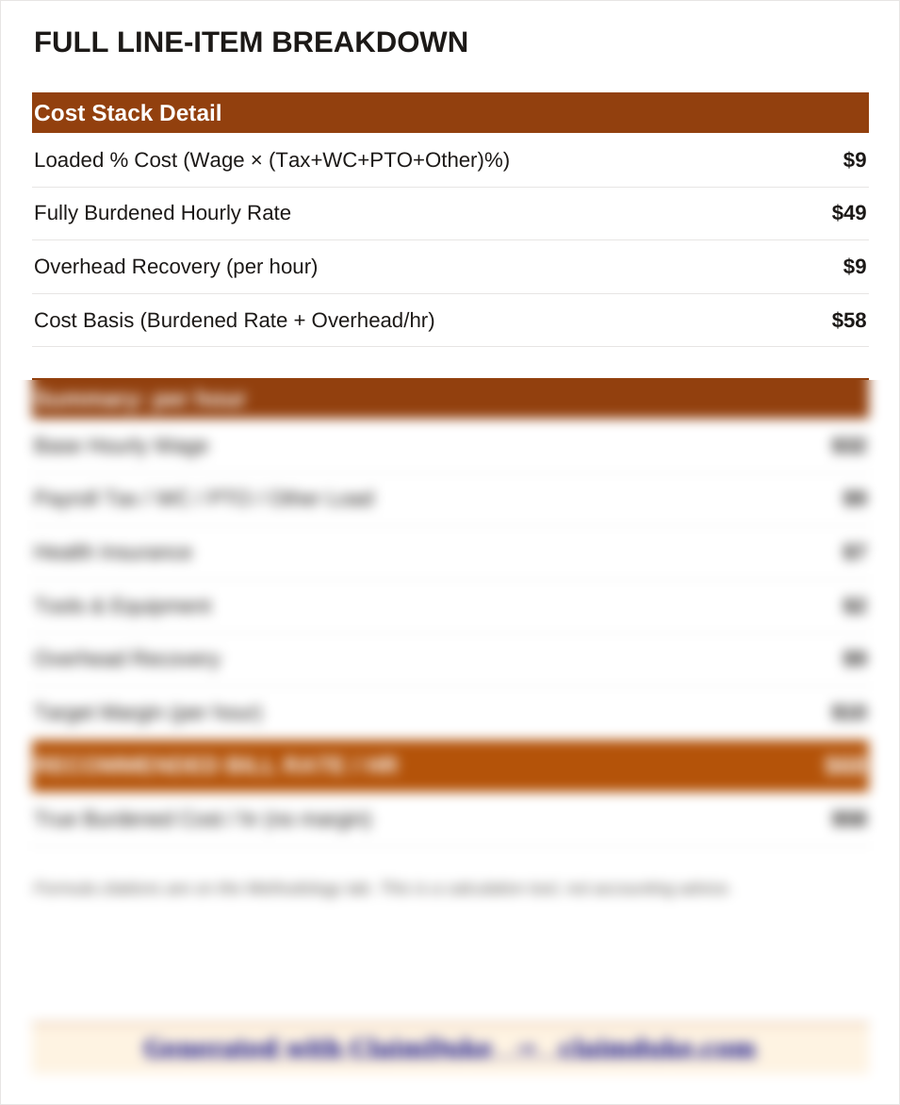
The sample PDF above shows the report. This is the Full Line-Item Breakdown
sheet from the formatted Excel workbook a paid report also includes, rendered from an
actual generated workbook rather than a mock-up. Every figure on it is a live formula
reading from an Inputs tab, so changing an input recalculates the whole workbook.
Excel workbook, Full Line-Item Breakdown sheet. Lower rows are obscured on purpose; the full sheet comes with a paid report.
Sample versus a paid report
The sample is a fixed, watermarked PDF. A paid report is generated live from your own
figures and adds a formatted Excel workbook with working formulas, a matching Word
document, an unwatermarked PDF and your own logo or letterhead. The monthly plan
additionally includes a Scenario Comparison sheet for modelling conservative, likely and
aggressive positions.