This sample shows statutory interest accrued on an unpaid balance and netted against a liquidated damages assessment, which is the shape most settlement positions take.
The sample is the complete report as a watermarked PDF, using illustrative figures,
not real project data. Your own report is generated live from the numbers you enter and is
not watermarked.
Advertisement
What the sample contains
Transmittal letter, addressed and ready to sign
Cover page with prepared-by / prepared-for details, the headline figure and the basis of the calculation
Full line-item breakdown showing each intermediate step and how the total is built
Methodology & citations documenting the formula behind every line
Supporting documents checklist for submission to an owner, insurer or counsel
What you need to run one of these
Under ten minutes. The work is in establishing the accrual date, not in the arithmetic.
Principal amount outstanding
Accrual start date and the event that triggers it
Statutory or contract interest rate and the compounding convention
Payment history, if partial payments were made
Liquidated damages daily rate and the days assessed, if any
Verify the rate against the official source for each year of accrual. Several states float against a federal benchmark and reset on a published schedule, so one rate across a three-year accrual will be wrong.
Nothing you enter is uploaded. The calculation and the parsing of any spreadsheet
you import happens entirely in your own browser.
How to read this report
Interest is shown as an accrual over the period rather than a single figure, so you can see the effect of the rate, the accrual date and the compounding convention independently. Liquidated damages accrue on their own line in the opposite direction and the net position is the last row rather than the first.
What reviewers look for
The accrual date gets challenged more often than the rate. The report states the date, the trigger relied on and the citation for the rate, which turns a contestable assertion into something the other side has to argue against with their own authority.
Who uses this report
Construction attorneys building a settlement position, contractors assessing whether a long-outstanding receivable is worth pursuing and consultants netting competing claims into a single number for mediation.
Whichever you are, the arithmetic is free: run the
calculator as many times as you like and pay only
when you want the branded, citation-backed document assembled.
Frequently asked questions
Are these real claim figures?
No. Every sample uses illustrative figures rather than real project or claimant data. The point is to show the layout, the level of detail and the methodology, so you can judge whether the finished report is what you need before you pay for one.
What is the difference between the sample and what I would get?
The sample is a watermarked PDF. A paid report is unwatermarked, carries your own logo and company details and comes as a live-formula Excel workbook and an editable Word document alongside the PDF.
Can I edit the numbers after export?
Yes. The Excel workbook keeps working formulas rather than pasted values, so changing an input updates the totals. The Word document is a normal editable document.
Methodology used in this report
Simple Interest
Principal × Rate × (Days ÷ 365).
Compound Interest
Principal × ((1 + Rate/n)^(n×t) − 1), where n is compounding periods per year and t is elapsed years.
Net Offset
Contractor Extended GC Claim − Owner LD Assessment, applied to the total only when positive.
Rate Selection
Statutory prejudgment and postjudgment rates, accrual start dates and compounding treatment vary by state and often float on a published schedule.
What the paid Excel workbook looks like
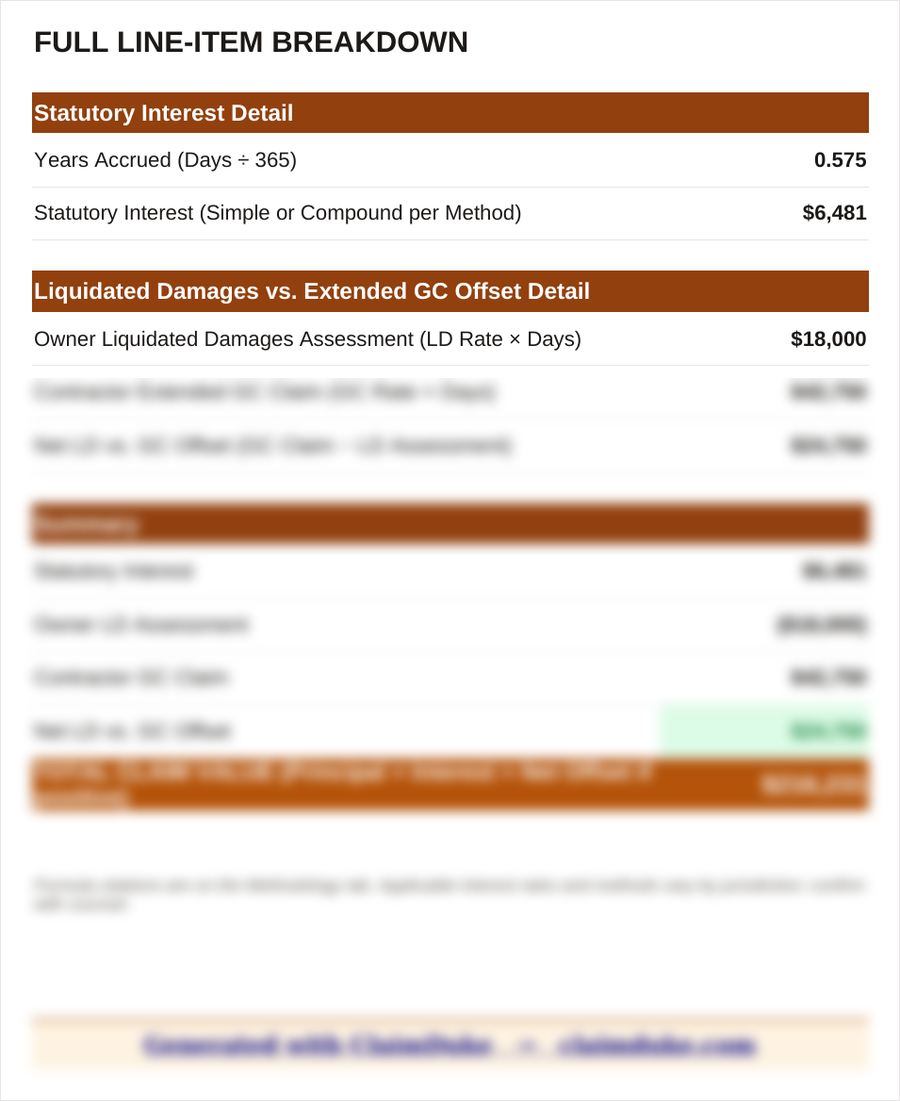
The sample PDF above shows the report. This is the Full Line-Item Breakdown
sheet from the formatted Excel workbook a paid report also includes, rendered from an
actual generated workbook rather than a mock-up. Every figure on it is a live formula
reading from an Inputs tab, so changing an input recalculates the whole workbook.
Excel workbook, Full Line-Item Breakdown sheet. Lower rows are obscured on purpose; the full sheet comes with a paid report.
Sample versus a paid report
The sample is a fixed, watermarked PDF. A paid report is generated live from your own
figures and adds a formatted Excel workbook with working formulas, a matching Word
document, an unwatermarked PDF and your own logo or letterhead. The monthly plan
additionally includes a Scenario Comparison sheet for modelling conservative, likely and
aggressive positions.