This sample shows how ClaimDuke frames a third-party construction injury claim: documented economic losses, a general-damages figure, the reduction for the worker's own share of fault under the governing state's rule and then the attorney fee, case costs and comp lien that separate a recovery from what the client banks. It does not compute workers' compensation benefits.
The sample is the complete report as a watermarked PDF, using illustrative figures,
not real project data. Your own report is generated live from the numbers you enter and is
not watermarked.
Advertisement
What the sample contains
Transmittal letter, addressed and ready to sign
Cover page with prepared-by / prepared-for details, the headline figure and the basis of the calculation
Full line-item breakdown showing each intermediate step and how the total is built
Methodology & citations documenting the formula behind every line
Supporting documents checklist for submission to an owner, insurer or counsel
What you need to run one of these
Ten to fifteen minutes once the medical specials and the lien figure are known. Getting a current written lien statement from the comp carrier is usually the long pole.
Past medical bills and projected future medical costs
Lost earnings to date and diminished future earning capacity
Multiplier or per-diem basis for non-economic damages
The governing state, which sets the comparative negligence rule
The injured worker's fault percentage, if contested
Workers' compensation benefits paid and the carrier's lien figure
Attorney fee percentage and case costs, for the net-to-client figure
Enter the governing state before anything else. It decides whether a fault allocation reduces the recovery proportionally, bars it above a threshold, or defeats it entirely and that changes the answer more than any other input.
Nothing you enter is uploaded. The calculation and the parsing of any spreadsheet
you import happens entirely in your own browser.
How to read this report
Read the gross figure and the net figure together. The gross is the damages before fault allocation; the net is what actually reaches the client after comparative fault, the comp lien, attorney fees and case costs. The gap between them is frequently larger than people expect, which is exactly why both are shown.
What reviewers look for
Defence counsel and carrier reviewers go straight to the comparative fault treatment and the lien figure. The report names the governing state's negligence rule with its authority and shows lien treatment as an explicit election rather than a hidden assumption.
Who uses this report
Plaintiff-side construction injury attorneys sizing a claim before filing, claims consultants preparing a mediation position and anyone who needs a defensible preliminary number before commissioning a forensic economist.
Whichever you are, the arithmetic is free: run the
calculator as many times as you like and pay only
when you want the branded, citation-backed document assembled.
Frequently asked questions
Are these real claim figures?
No. Every sample uses illustrative figures rather than real project or claimant data. The point is to show the layout, the level of detail and the methodology, so you can judge whether the finished report is what you need before you pay for one.
What is the difference between the sample and what I would get?
The sample is a watermarked PDF. A paid report is unwatermarked, carries your own logo and company details and comes as a live-formula Excel workbook and an editable Word document alongside the PDF.
Can I edit the numbers after export?
Yes. The Excel workbook keeps working formulas rather than pasted values, so changing an input updates the totals. The Word document is a normal editable document.
Methodology used in this report
Special Damages
The sum of documented economic losses: medical bills incurred, estimated future medical costs, wages lost to date, future lost earning capacity and property damage. Economic losses are never limited by a non-economic damages cap.
General Damages: Multiplier Method
Special Damages × Severity Multiplier, reflecting injury severity, permanence and impact on daily life. A negotiating convention, not a formula any court is required to apply.
General Damages: Per-Diem Alternative
Daily Rate × Days to Maximum Medical Improvement, often preferred for injuries with a defined recovery period.
Comparative Negligence
Recovery After Fault = (Special + Capped General Damages) × (1 − Worker's Own Fault %), or zero where the governing state's bar applies. Treatment varies sharply by state: pure comparative, modified comparative with a 50% or 51% bar, or pure contributory negligence, which bars recovery on any fault at all. ClaimDuke carries the rule and the controlling citation for all 51 jurisdictions and applies the one for the state you select. The sample is a Colorado claim: modified comparative, barred at 50%, C.R.S. § 13-21-111.
Non-Economic Damages Cap
A minority of states cap non-economic (general) damages in ordinary personal-injury actions; economic losses are not capped by those statutes. ClaimDuke applies the cap for the state you select, with its citation, computes the indexed ones from their statutory escalator so they do not go stale and reports caps that have been struck down as unenforceable rather than applying them. A figure you enter yourself is always reported as yours, never as the state's.
Attorney Fee, Case Costs and the Comp Lien
Net to Client = Recovery After Fault − Attorney Fee − Case Costs − Workers' Comp Lien. A recovery figure is not what the client receives. Where workers' compensation has paid benefits the carrier commonly holds a subrogation lien against the third-party recovery; the report can reduce it pro rata for the attorney fee under common-fund principles, or take it at full reimbursement.
Employer Exclusive Remedy
An injured worker's own direct employer is generally shielded from an ordinary negligence suit in exchange for no-fault workers' compensation coverage. This calculation applies only to a claim against a separate third party.
What the paid Excel workbook looks like
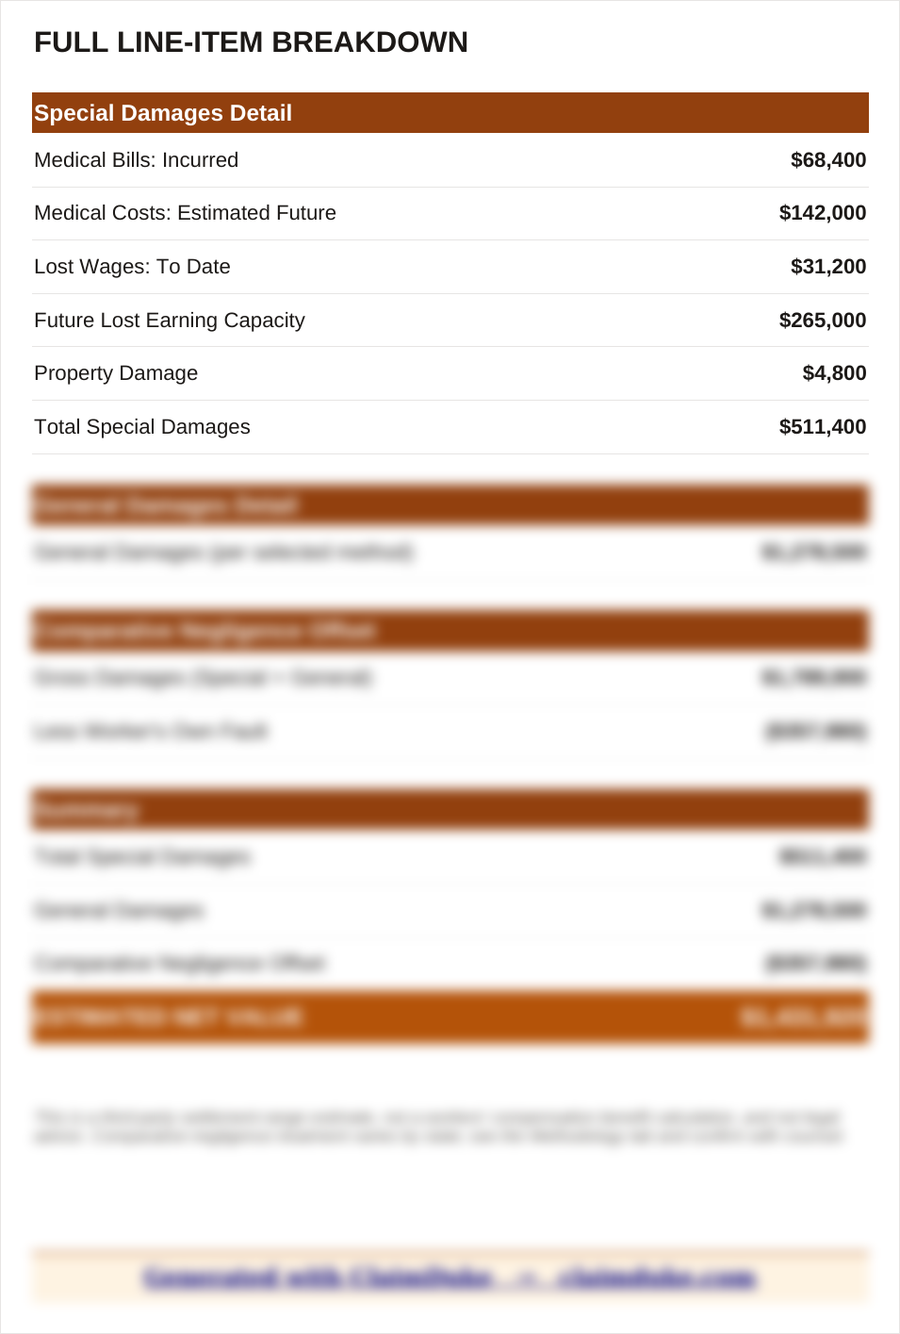
The sample PDF above shows the report. This is the Full Line-Item Breakdown
sheet from the formatted Excel workbook a paid report also includes, rendered from an
actual generated workbook rather than a mock-up. Every figure on it is a live formula
reading from an Inputs tab, so changing an input recalculates the whole workbook.
Excel workbook, Full Line-Item Breakdown sheet. Lower rows are obscured on purpose; the full sheet comes with a paid report.
Sample versus a paid report
The sample is a fixed, watermarked PDF. A paid report is generated live from your own
figures and adds a formatted Excel workbook with working formulas, a matching Word
document, an unwatermarked PDF and your own logo or letterhead. The monthly plan
additionally includes a Scenario Comparison sheet for modelling conservative, likely and
aggressive positions.